The Correlation between
Salinity Resistance Indices and Maize Yield in Stress and Non Stress Conditions
Davar Molazem,
Faculty Member of Islamic
Abstract
In this research, eight varieties of maize (Zea mays L.)were studied in
two separate Randomized Complete Block Design (RCBD) field experiments.
Cultivars included K3615/1, S.C704, B73, S.C302, Waxy, K3546/6, K3653/2, and
Zaqatala and they were cultivated in two pieces of land in Astara: one with
normal soil and the other with salty soil. Five abiotic tolerance indices
comprising: stress tolerance index (STI), stress tolerance (TOL), stress
susceptibility index (SSI), mean productivity (MP), and geometric mean
productivity (GMP) were used. The indices were adjusted based on grain yield
under salinity (Ys) and normal (Yp) conditions. This would imply the
difficulties of yield improvement in normal conditions for high yield
performance in salty condition. Correlation between MP and Ys was
significant(r=0.588, p<0.01). Correlation between tolerance and Yp was
positive and significant (r=0.821, p<0.01) and relationship between Ys and
TOL was negative and significant (r=-0.525, p<0.01) Based on the most of the
estimated resistance indices S.C704, S.C302 and Zaqatala were the best
cultivars.
Introduction
Earth is a salty planet, with most of its
water containing about
Materials and Methods
Considering
![]()
SI is the stress intensity and calculated as:
![]()
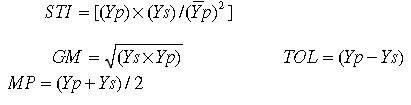
where Ys and Yp are the yields of genotypes
evaluated under stress and non-stress conditions and Ys and Yp are
the mean yields over all genotypes evaluated under stress and non-stress
conditions. ![]() = mean yield in non-stressed environment.
= mean yield in non-stressed environment. ![]() = mean yield in salty stressed environment.
= mean yield in salty stressed environment.
The optimal selection criterion should
distinguish genotypes express uniform superiority in both tress and nonstress environments
from the genotypes that are favorable only in one environment E1 or E2). Among
the stress tolerance indicators, a larger value of TOL and SSI represent relatively
more sensitivity to stress, thus a smaller value of TOL and SSI are favored.
Selection based on these two criteria favors genotypes with low yield potentional
under non-stress onditions and high yield under stress conditions. On the other
hand, selection based on STI and MP will be resulted in genotypes with higher
stress tolerance and yield potential will be selected [3].
Correlation between yield and salinity
tolerance indices was evaluated by MSTATC and SPSS computer programs.
Results and Discussion
Stress Intensity (SI) was higher in this experiment
(SI=0.55). SI ranges between 0and1 and the larger the value of SI, the more
sever is the stress intensity.
To determine the most desirable
salty tolerance criteria, the correlation coefficient between Yp, Ys and other
quantitative indices of salty tolerance were calculated (Table1). Correlation between Yp and Ys was
non significant(r=0.054).So, yield selection in non stress conditions increased
yield only in non stress environment and yield selection in stress conditions
caused higher yield in this conditions(Table 1).Mean Productivity(MP) favors
higher yield potential and lower stress tolerance. Correlation between MP
and Yp was significant(r=0.84, p<0.01). Correlation between MP and Ys
was significant (r=0.588, p<0.01) (Table 1).
Thus, selection based on Mp can be increased yield in stress environments.
S.C704, Zaqatala and S.C302 were the best maize cultivar based on
this index (Table 2). positive and
significant correlations among Yp and (MP,GMP and STI) and Ys and (MP, GMP and
STI) and they hence were better predictors of Yp and Ys than TOL and
SSI. The observed relationship between Yp and (MP and STI) and Ys and (MP and
STI) are in consistent with those reported by Fernandez [3] in mungbean and
Farshadfar [2] in maize. Ramirez and Kelly [9] observed positive and
significant correlation of some yield components with geometric mean yield (GMP)
in common bean. Nasir ud-Din et al [7] showed significant and positive
correlation between Ys and TOL, and Ys and Mp as well as between Yp and MP,
while TOL was negatively correlated with Yp and MP.
Table 1.
Correlation
coefficients among salty resistance indices and grain yield in stressed and no
stressed environments.
|
|
Yp |
Ys |
SSI |
TOL |
MP |
GMP |
|
|
Yp |
1 |
.054 |
.495* |
.821** |
.840** |
.585** |
.558** |
|
Ys |
|
1 |
-.779** |
-.525** |
.588** |
.837** |
.844** |
|
SSI |
|
|
1 |
.867** |
-.022 |
-.345 |
-.347 |
|
TOL |
|
|
|
1 |
.380 |
.021 |
-.007 |
|
MP |
|
|
|
|
1 |
.929** |
.911** |
|
GMP |
|
|
|
|
|
1 |
.989** |
|
STI |
|
|
|
|
|
|
1 |
* significant difference in probability level of 5%
** significant difference in probability level of 1%
A larger value of TOl show more sensitivity
to stress, thus a smaller value of TOL is favored. Selection based on TOL favors
cultivars with low yield potential and high yield under stress conditions. Correlation
between tolerance and Yp was positive and significant (r=0.821, p<0.01) and
relationship between Ys and TOL was negative and significant(r=-0.525,
p<0.01)(Table 1).Waxy, S.C302, B73K3653/2 and
Zaqatala were the smallest TOL, so were the best cultivars based on this index (Table
2).
Mp is based on the arithmetic means and
therefore it has an upward bias due to a relatively large difference between Yp
and Ys, whereas the geometric mean is less sensitive to large extreme value [3].
Relationship between GMP and Yp was significant and positive (r=0.558,
p<0.01) (Table 1). S.C704, Zaqatala and
S.C302
were
the best cultivars based on this index (Table 2). The smaller SSI
caused the greater stress tolerance.ToL and SSI were positively
correlated(r=0.867, p<0.01). Correlation between SSI and Yp was significant
and positive(r=0.495, p<0.05).But correlation between Ys and SSI was
negative and significant(r=-0.779, p<0.01). (Table 1). Waxy, S.C302,
B73 and Zaqatala were the best cultivars based on this index (Table
2). The higher STI values caused higher stress tolerance and yield potential [3].
This index selected S.C704, Zaqatala and S.C302 (Table 2).
Table 2.
Ys,
Yp and salinity tolerance indices in maize genotypes.
|
variety |
Yp(g/plot) |
Ys ( g/plot) |
Mp ( g/plot) |
Tol |
Gmp |
Var |
STI |
SSI |
|
Zaqatala |
1797 |
865 |
1331 |
932 |
1246,76 |
1796,52 |
0,56 |
0,94 |
|
S.C302 |
1480 |
958,33 |
1219,17 |
521,67 |
1190,94 |
1479,35 |
0,51 |
0,64 |
|
k3653,2 |
1373 |
613,33 |
993,17 |
759,67 |
917,66 |
1372,55 |
0,272 |
1,01 |
|
B73 |
1437 |
695 |
1066 |
742 |
999,36 |
1436,52 |
0,36 |
0,94 |
|
S.C704 |
2350 |
1041,67 |
1695,83 |
1308,33 |
1564,58 |
2349,56 |
0,88 |
1,01 |
|
Waxy |
1230 |
736,67 |
983,33 |
493,33 |
951,89 |
1229,4 |
0,353 |
0,73 |
|
K3615.1 |
1910 |
496,67 |
1203,33 |
1413,33 |
973,98 |
1909,74 |
0,34 |
1,35 |
|
K3545.6 |
1737 |
525 |
1131 |
1212 |
954,95 |
1736,7 |
0,33 |
1,27 |
STI=
stress tolerance index, TOL= stress tolerance, SSI= stress susceptibility
index, MP= mean productivity, GMP= geometric mean productivity, Ys= grain yield
under salt conditions and Yp= grain yield under normal conditions.
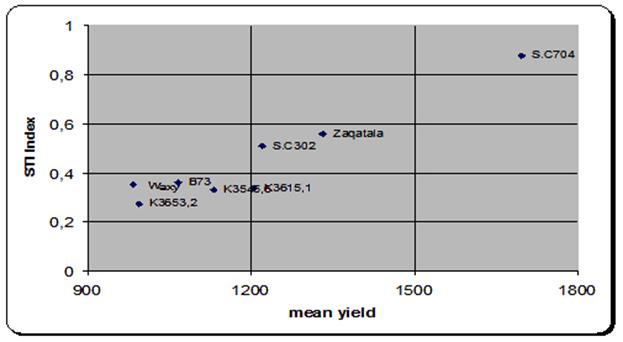
Figure 1. Diagram of STI
index in eight cultivars of the maize .
References
1.
Colmer
TD, Munns R, Flowers TJ. 2005. Improving salt tolerance of wheat and barley:
future prospects. Australian Journal of Experimental Agriculture 45, 1425–1443.
2.
Farshadfar
E, Sutka J .2002. Multivariate analysis of drought tolerance in wheat
substitution lines. Cereal Res. Commun. 31: 33-39.
3.
Fernandez
G.C.J.1992. Effective selection criteria for assessing plant stress
tolerance.PP.270.in:Kuo,CG.(ed).proceedings of tht International symposium on
Adaptation of Vegetables and other Food Crops to Temperature Water stress.Taiwan.
4.
Fischer R.A.,and
maurer, R.1978.drought resistance in spring wheat cultivar.I.grain yield
responses Australian journal of Agricultural research 29:897-912.
5.
Flowers
TJ, Yeo AR. 1995. Breeding for salinity resistance in crop plants Ðwhere
next? Australian Journal of Plant Physiology 22, 875-884.
6.
Munns
R. 2002. Comparative physiology of salt and water stress. Plant, Cell and
Environment 25, 239-250.
7.
Nasir
Ud-Din, Carver BF, Clutter AC .1992. Genetic analysis and selection for wheat
yield in drought-stressed and irrigated environments. Euphytica 62: 89-96.
8.
Pitman
MG, Lauchli A. 2002. Global impact of salinity and agricultural ecosystems. In:
Lauchli A, Luttge U, eds. Salinity: environment – plants – molecules.
9.
Ramirez
P, Kelly JD .1998. Traits related to drought resistance in common bean.
Euphytica 99: 127-136.
10.
Rosielle A.A.,and
hamblin,J.1981.Theoretical aspects of selection for field in stress and
non-stress environments.Crop Science 21:943-946.
Поступила в редакцию 02.02.2010 г.