Stock indexes multifractal analysis
Andrejs Pučkovs,
Economist, Mg. oec., PhD student of Riga Technical University.
This article is dedicated for Stock indexes multifractal analysis using so called Wavelet Transform Modulus Maxima (WTMM) approach. This approach is narrated in articles: “Wavelet analysis in Wavelet Transform Modulus Maxima Approach” and “Multifractal formalism in Wavelet Transform Modulus Maxima Approach” published in current journal.
For current research were taken decent capital market index close prices. Considered close prices to be most representative, because most of deals are done by institutional investors at the end of trading day. But there are also opinions in some researches that intraday prices are more representative for time series research. Most of indexes are considered for the whole available period of time, see the table data [[1]].
Table 1.
Research objects data.
|
Index name |
Code |
Data available |
Reference |
|
|
from |
to |
|||
|
IBEX35 index |
IBEX35 |
1993.VII |
2012.VI |
[[2]] |
|
DAX30 index |
DAX30 |
1990.XI |
2012.VI |
[[3]] |
|
Swiss Market Index |
SMI |
1990.XI |
2012.VI |
[[4]] |
|
CAC40 index |
CAC40 |
1990.III |
2012.VI |
[[5]] |
|
FTSE100 index |
FTSE |
1984.IV |
2012.VI |
[[6]] |
|
Dow Jones Industrial index |
DJIA |
1980.I |
2012.VI |
[[7]] |
|
Amsterdam Exchange index |
AEX |
1992.X |
2012.VI |
[[8]] |
|
Hang Seng index |
HSI |
1986.XII |
2012.VI |
[[9]] |
|
NIKKEI225 index |
Nikkei225 |
1984.I |
2012.VI |
[[10]] |
|
Straits Times Index {Singapore} |
STI |
1988.I |
2012.VI |
[[11]] |
|
Philippines Stock Exchange Index |
PSEI |
2000.I |
2012.VI |
[[12]] |
|
BSE India Sensex 30 Index |
BSESN |
1997.VII |
2012.VI |
[[13]] |
Here and further stock indexes multifractal analysis algorithm is shown on Hang Seng index example. First index data is represented in log-scale, see 1. fig.
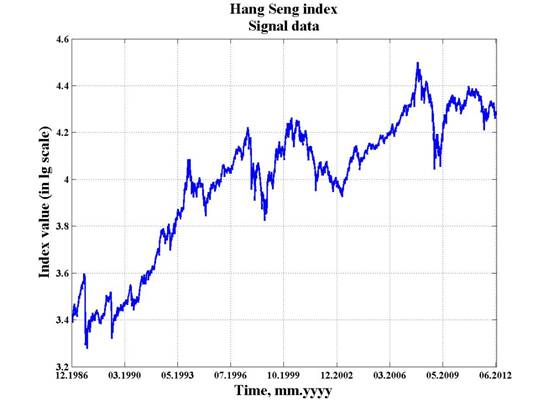
Fig. 1. Hang Seng index data (represented in log-scale).
Direct Continuous Wavelet transform is illustrated in next figure.
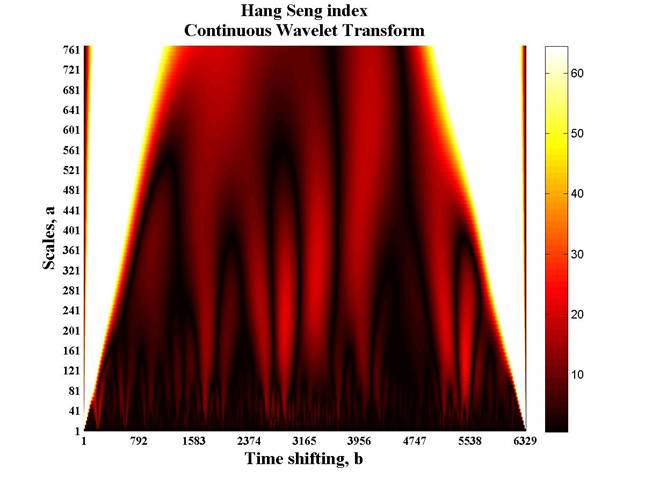
Fig. 2. Hang Seng index Continuous Wavelet Transform.
Hang Seng index Continuous Wavelet Transform figure shows wavelet coefficients in decent shifting and scales parameters. Wavelet coefficients matrix can be represented in three dimensional graph, but in can be also represented as wavelet coefficient projection onto the plane formed by the shift and scaling parameters as it is realized here. Wavelet coefficients are shown in its absolute values and colorized in accordance with colorbar. Dark colors correspond to lower absolute wavelet coefficients values. Light colors indicate higher absolute wavelet coefficients values. Wavelet coefficient matrix allows Local maxima lines selection or Skeleton function construction, see 3. fig.
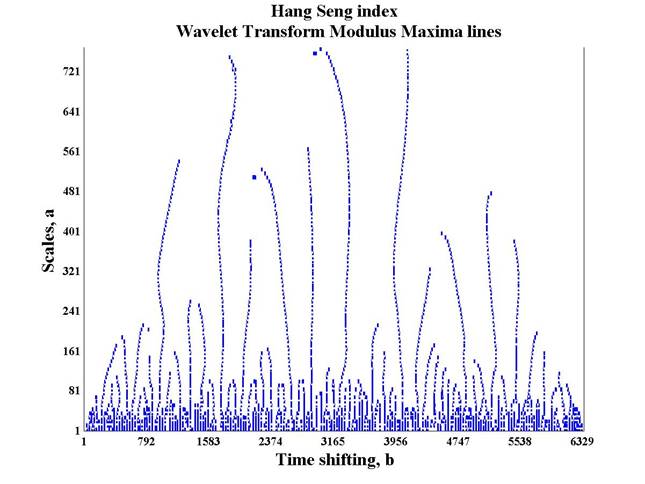
Fig. 3. Hang Seng index Skeleton function.
Local maxima lines are constructed using Wavelet coefficient matrix, selecting local maxima points on each scale parameter. The scope of all local maxima lines build so called Skeleton function. This function illuminates periodicity of the signal on decent scales. Naturally stock indexes show periodicity affected by population cycles, economical cycles, moon cycles, stock exchange cycles and events. In common the Skeleton function shows the scalability of the signal. Local maxima lines are designed to select the Skeleton (basics of wavelet coefficient matrix) in order to simplify multifractal analysis in the whole wavelet coefficient matrix to multifractal analysis within wavelet coefficients on Skeleton.
Since Hang Seng index Skeleton is constructed, Thermodynamics partition function is estimated (see 4. fig.).
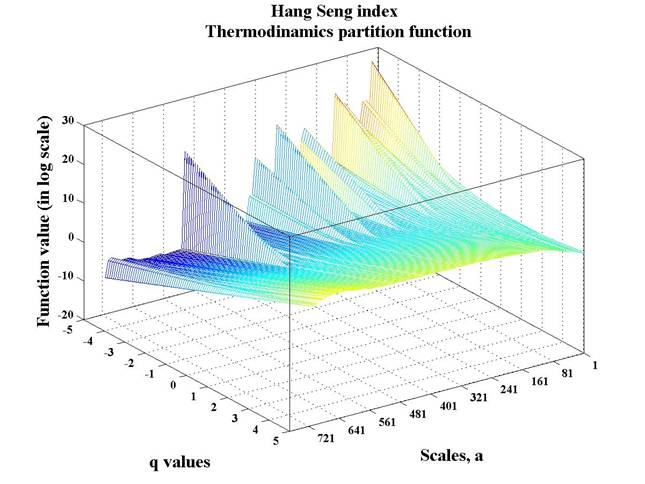
Fig. 4. Hang Seng index Thermodynamics Partition Function.
Hang Seng index Thermodynamics Partition
function is a three dimensional graph – function of two arguments - scaling
parameter a and power argument q. Power argument q
is the set of zero-mean numbers (in interval![]() ). Thermodynamic partition function is
designed to eliminate the presence of wavelet modulus maxima coefficients of
different values. [[14]]
). Thermodynamic partition function is
designed to eliminate the presence of wavelet modulus maxima coefficients of
different values. [[14]]
Scaling parameter a is an argument of Thermodynamics Partition function, that, by its nature is the scaling “etalon” for Thermodynamics Partition function value. Interdependence between Thermodynamics Partition function value and scaling parameter a discovers the scalability of signal. In order to discover the scalability of Hang Seng index, Local Scaling Exponent Function is represented in 5. fig.
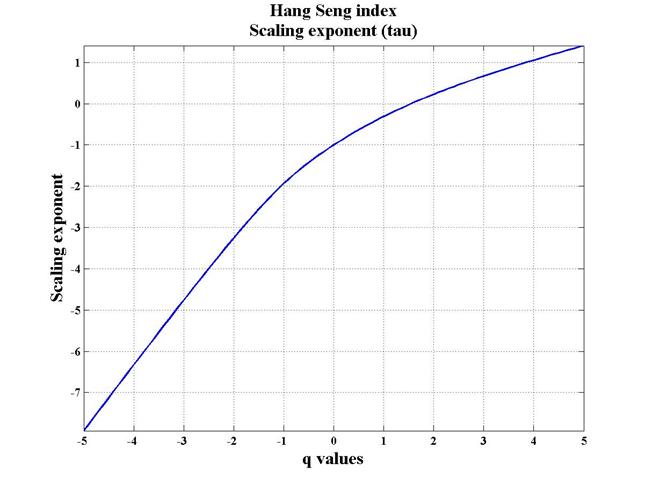
Fig. 5. Hang Seng index Local Scaling Exponent Function.
Hang Seng index scaling exponent function is everywhere convex, what points out multifractal behaviour of the index. Multifractal behaviour of stock index assumes index does not have some decent fractal measure, but is characterized by the scope of fractal measures. [[15]] In case of monofractal, scaling exponent function is line.
For detailed Hang Seng index multifractal analysis, its multifractal spectrum is presented in 5. fig.
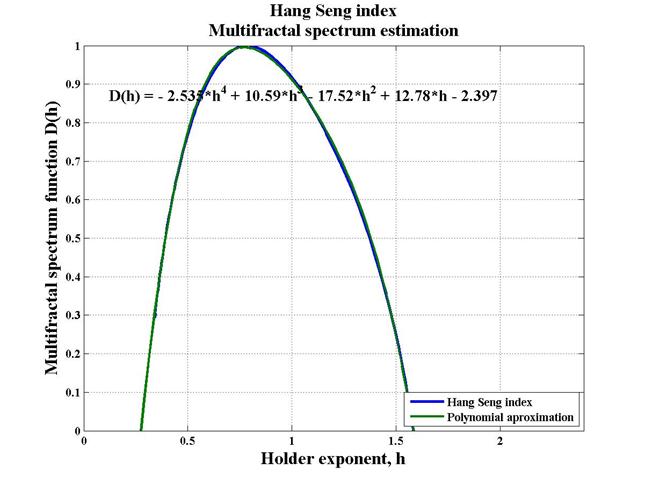
Fig. 6. Hang Seng index Multifractal spectrum estimation (polynomial approximation).
Hang Seng index Multifractal spectrum is bell-shaped function, which branches are directed downwards, with high correlation, Multifractal spectrum function is approximated with 4-th degree polynomial.
All steps of WTMM approach are done for all objects of experiment. Multifractal Spectrums are approximated with 4-th degree polynomial, using formula:
 (1)
(1)
where: D – multifractal spectrum; h – Holder exponent; k – polynomial coefficients; i - polynomial coefficient index i =0,1,…4.[[16]]
Estimated Multifractal Spectrums are analyzed in crosscorrelation matrix using Pearson correlation coefficients. See results in tab. 2 and tab. 3.
Results
1. According to multifractal analysis, all research objects demonstrate strong multifractal behaviour. Multifractal spectrum approximations polynomial coefficients are shown in 2. tab.
Table 2.
Multifractal spectrum approximation with quadratic function, coefficients and spectrum maxima.
|
Index name |
Polynomial coefficients |
Holder exponent |
|||||||
|
k4 |
k3 |
k2 |
k1 |
k0 |
h0 |
hmin |
hmax |
Dh |
|
|
IBEX35 index |
-2,17 |
10,83 |
-20,89 |
17,48 |
-4,29 |
0,89 |
0,46 |
1,80 |
1,34 |
|
DAX30 index |
-6,52 |
29,83 |
-51,79 |
39,42 |
-10,00 |
0,85 |
0,58 |
1,53 |
0,95 |
|
Swiss Market Index |
-5,42 |
24,17 |
-42,42 |
33,25 |
-8,64 |
0,88 |
0,57 |
1,46 |
0,89 |
|
CAC40 index |
-6,21 |
28,52 |
-49,70 |
38,19 |
-9,83 |
0,89 |
0,61 |
1,60 |
0,99 |
|
FTSE100 index |
-16,52 |
67,11 |
-103,02 |
69,49 |
-16,26 |
0,74 |
0,55 |
1,32 |
0,77 |
|
Dow Jones Industrial index |
-7,75 |
32,89 |
-52,18 |
35,65 |
-7,80 |
0,70 |
0,49 |
1,49 |
1,01 |
|
Amsterdam Exchange index |
-2,68 |
11,33 |
-19,53 |
15,12 |
-3,31 |
0,85 |
0,44 |
1,52 |
1,08 |
|
Hang Seng index |
-2,54 |
10,59 |
-17,52 |
12,78 |
-2,40 |
0,80 |
0,34 |
1,60 |
1,26 |
|
NIKKEI225 index |
-16,41 |
62,61 |
-88,39 |
53,69 |
-10,76 |
0,59 |
0,50 |
1,35 |
0,85 |
|
Straits Times Index {Singapore} |
-2,10 |
8,03 |
-12,65 |
9,00 |
-1,37 |
0,75 |
0,25 |
1,52 |
1,27 |
|
Philippines Stock Exchange Index |
-2,08 |
10,78 |
-21,93 |
17,45 |
-3,70 |
0,64 |
0,39 |
1,15 |
0,76 |
|
BSE India Sensex 30 Index |
0,34 |
1,14 |
-7,72 |
8,31 |
-1,53 |
0,63 |
0,27 |
1,10 |
0,83 |
2.
Most typical fractal measures are
discoverable by h0 value. This value show typical fractal measure of
signal – higher h0 values, indicate anti-persistent properties, but
lower - indicate the presence of fractal properties of time series,
consequently indicate a persistent or trend sustained properties of time
series. Spectrum maxima (h0 indicator) for all indexes are about 0,77, ![]() what indicates the presence of
fractal properties of time series consequently that shows persistent or trend
sustainable properties of indexes.
what indicates the presence of
fractal properties of time series consequently that shows persistent or trend
sustainable properties of indexes.
3.
Fuzziness of the multifractal spectrum imply
how regular is a fractal, if fuzziness of multifractal spectrum is low, fractal
is quite regular. Fuzziness of the multifractal spectrum is indicated with Dh indicator; higher Dh
indicators (![]() )
are demonstrated by IBEX35 index, Hang Seng index, Straits Times Index
{Singapore}. Lower Dh indicators are demonstrated by FTSE100
index and NIKKEI225 index. Expect, FTSE100 index and NIKKEI225 have more
regular fractal properties, but IBEX35 index, Hang Seng index, Straits Times
Index {Singapore} contain wide scope of fractal measures.
)
are demonstrated by IBEX35 index, Hang Seng index, Straits Times Index
{Singapore}. Lower Dh indicators are demonstrated by FTSE100
index and NIKKEI225 index. Expect, FTSE100 index and NIKKEI225 have more
regular fractal properties, but IBEX35 index, Hang Seng index, Straits Times
Index {Singapore} contain wide scope of fractal measures.
4.
Fuzziness of the multifractal spectrum is
indicated also with higher k4 polynomial coefficient. Higher k4
polynomial coefficients ![]() have Straits Times Index {Singapore},
Philippines Stock Exchange Index, IBEX35 index and Hang Seng index. Actually it
is difficult to make any conclusion about fuzziness of the multifractal
spectrum by k4 polynomial coefficient because correlation between
multifractal spectrum and its approximation should be taken on account. In
lower approximation correlation case, Dh indicator should be helpful. But the presence of both higher
polynomial coefficient k4 and higher Dh indicator clearly proves the fuzziness of multifractal spectrum,
e.g. for Straits Times Index {Singapore}, IBEX35 index and Hang Seng index.
Analogically the presence of both lower polynomial coefficient k4 and
lower Dh in the same time indicate regularity
of fractal properties, e.g. for FTSE100 index and NIKKEI225.
have Straits Times Index {Singapore},
Philippines Stock Exchange Index, IBEX35 index and Hang Seng index. Actually it
is difficult to make any conclusion about fuzziness of the multifractal
spectrum by k4 polynomial coefficient because correlation between
multifractal spectrum and its approximation should be taken on account. In
lower approximation correlation case, Dh indicator should be helpful. But the presence of both higher
polynomial coefficient k4 and higher Dh indicator clearly proves the fuzziness of multifractal spectrum,
e.g. for Straits Times Index {Singapore}, IBEX35 index and Hang Seng index.
Analogically the presence of both lower polynomial coefficient k4 and
lower Dh in the same time indicate regularity
of fractal properties, e.g. for FTSE100 index and NIKKEI225.
At the end cross correlation research results are shown next.
Table 3.
Multifractal Spectrums Crosscorrelation Matrix (in percent).
|
|
IBEX 35 index |
DAX 30 index |
Swiss Market Index |
CAC 40 index |
FTSE 100 index |
Dow Jones Indus- trial index |
Ams- terdam Excha- nge index |
Hang Seng index |
NIK- KEI 225 index |
Straits Times Index {Singa- pore} |
PSEI Index {Phili- pines} |
|
DAX30 index |
99,8 |
|
|
|
|
|
|
|
|
|
|
|
Swiss Market Index |
99,6 |
99,0 |
|
|
|
|
|
|
|
|
|
|
CAC40 index |
99,3 |
99,8 |
98,1 |
|
|
|
|
|
|
|
|
|
FTSE100 index |
96,2 |
95,6 |
98,1 |
93,5 |
|
|
|
|
|
|
|
|
Dow Jones Industrial index |
95,2 |
94,7 |
97,0 |
92,3 |
99,5 |
|
|
|
|
|
|
|
Amsterdam Exchange index |
91,3 |
89,3 |
94,4 |
86,2 |
97,8 |
97,2 |
|
|
|
|
|
|
Hang Seng index |
83,7 |
81,4 |
88,0 |
77,3 |
94,2 |
94,5 |
98,6 |
|
|
|
|
|
NIKKEI225 index |
79,3 |
77,7 |
84,3 |
73,5 |
92,8 |
92,8 |
95,7 |
97,9 |
|
|
|
|
Straits Times Index {Singapore} |
63,6 |
60,2 |
70,0 |
54,9 |
80,1 |
80,4 |
89,6 |
95,2 |
94,6 |
|
|
|
PSEI Index {Philipines} |
42,4 |
39,1 |
49,2 |
32,7 |
62,3 |
65,3 |
74,1 |
84,2 |
83,2 |
94,2 |
|
|
BSE India Sensex 30 Index |
17,6 |
13,9 |
25,1 |
7,1 |
39,7 |
43,3 |
54,5 |
67,5 |
66,6 |
84,0 |
96,5 |
According to Multifractal spectrums crosscorrelation matrix, almost all research objects prove very strong correlation in multifractal spectrums (ex small Asia indexes: Straits Times Index {Singapore}, PSEI Index {Philipines}, BSE India Sensex 30 Index). All indexes can be roughly divided in three main groups: European indexes (DAX30 index, Swiss Market Index, CAC40 index, FTSE100 index), Global group including European indexes and Dow Jones Industrial index, Amsterdam Exchange index, Hang Seng index, NIKKEI225 index, and Asia indexes (BSE India Sensex 30 Index, PSEI Index {Philipines}, Straits Times Index {Singapore}, Hang Seng index, NIKKEI225 index). Some of these indexes are included in various groups.
Despite all indexes are represented for various period of time, multifractal spectrums crosscorrelation matrix can classify stock indexes by their fractal properties. Suppose, related indexes are very similar in their behaviour: that assumes an ‘ability’ to fix, hold and maintain market information in ‘certain way’. Practically that assumes all indexes are interdependent, global and operate as a single organism.
Bibliography
1. http://en.wikipedia.org. Polynomial [http://en.wikipedia.org/wiki/Polynomial]. (Accessed 1. July 2012).
2. http://www.yahoo.com. Amsterdam Exchange index data.[http://finance.yahoo.com/q/hp?s=%5EAEX+Historical+Prices] (Accessed 1. July. 2012.).
3. http://www.yahoo.com. BSE India Sensex 30 Index data.[http://finance.yahoo.com/q/hp?s=%5EBSESN+Historical+Prices] (Accessed 1. July. 2012.).
4. http://www.yahoo.com. CAC40 index data.[http://finance.yahoo.com/q/hp?s=%5EFCHI+Historical+Prices] (Accessed 1. July. 2012.).
5. http://www.yahoo.com. DAX30 index data.[http://finance.yahoo.com/q/hp?s=%5EGDAXI+Historical+Prices] (Accessed 1. July. 2012.).
6. http://www.yahoo.com. Dow Jones Industrial index data.[http://finance.yahoo.com/q/hp?s=%5EDJI+Historical+Prices] (Accessed 1. July. 2012.).
7. http://www.yahoo.com. FTSE100 index data.[http://finance.yahoo.com/q/hp?s=%5EFTSE+Historical+Prices] (Accessed 1. July. 2012.).
8. http://www.yahoo.com. Hang Seng index data.[http://finance.yahoo.com/q/hp?s=%5EHSI+Historical+Prices] (Accessed 1. July. 2012.).
9. http://www.yahoo.com. IBEX35 index data.[http://finance.yahoo.com/q/hp?s=%5EIBEX+Historical+Prices] (Accessed 1. July. 2012.).
10. http://www.yahoo.com. NIKKEI225 index data.[http://finance.yahoo.com/q/hp?s=%5EN225+Historical+Prices] (Accessed 1. July. 2012.).
11. http://www.yahoo.com. Philippines Stock Exchange Index data.[http://finance.yahoo.com/q/hp?s=PSEI.PS+Historical+Prices] (Accessed 1. July. 2012.).
12. http://www.yahoo.com. Straits Times Index {Singapore}. Data[http://finance.yahoo.com/q/hp?s=%5ESTI+Historical+Prices] (Accessed 1. July. 2012.).
13. http://www.yahoo.com. Swiss Market Index data.[http://finance.yahoo.com/q/hp?s=%5ESSMI+Historical+Prices] (Accessed 1. July. 2012.).
Поступила в редакцию 16.07.2012 г.
[1] REM: The Dow Jones Industrial index is considered only from 1980 because of large computations.
[2] http://www.yahoo.com. IBEX35 index data.[http://finance.yahoo.com/q/hp?s=%5EIBEX+Historical+Prices] (Accessed 1. July. 2012.)
[3] http://www.yahoo.com. DAX30 index data.[http://finance.yahoo.com/q/hp?s=%5EGDAXI+Historical+Prices] (Accessed 1. July. 2012.)
[4] http://www.yahoo.com. Swiss Market Index data.[http://finance.yahoo.com/q/hp?s=%5ESSMI+Historical+Prices] (Accessed 1. July. 2012.)
[5] http://www.yahoo.com. CAC40 index data.[http://finance.yahoo.com/q/hp?s=%5EFCHI+Historical+Prices] (Accessed 1. July. 2012.)
[6] http://www.yahoo.com. FTSE100 index data.[http://finance.yahoo.com/q/hp?s=%5EFTSE+Historical+Prices] (Accessed 1. July. 2012.)
[7] http://www.yahoo.com. BSE India Sensex 30 Index data.[http://finance.yahoo.com/q/hp?s=%5EBSESN+Historical+Prices] (Accessed 1. July. 2012.)
[8] http://www.yahoo.com. Amsterdam Exchange index data.[http://finance.yahoo.com/q/hp?s=%5EAEX+Historical+Prices] (Accessed 1. July. 2012.)
[9] http://www.yahoo.com. Hang Seng index data.[http://finance.yahoo.com/q/hp?s=%5EHSI+Historical+Prices] (Accessed 1. July. 2012.)
[10] http://www.yahoo.com. NIKKEI225 index data.[http://finance.yahoo.com/q/hp?s=%5EN225+Historical+Prices] (Accessed 1. July. 2012.)
[11] http://www.yahoo.com. Straits Times Index {Singapore}. Data[http://finance.yahoo.com/q/hp?s=%5ESTI+Historical+Prices] (Accessed 1. July. 2012.)
[12] http://www.yahoo.com. Philippines Stock Exchange Index data.[http://finance.yahoo.com/q/hp?s=PSEI.PS+Historical+Prices] (Accessed 1. July. 2012.)
[13] http://www.yahoo.com. Dow Jones Industrial index data.[http://finance.yahoo.com/q/hp?s=%5EDJI+Historical+Prices] (Accessed 1. July. 2012.)
[14] REM: The presence of relative small wavelet modulus maxima coefficients are detectable with large Z values in case of negative q values; and the presence of relative large wavelet modulus maxima coefficients are detectable with large Z values in case of positive q values.
[15] REM: Estimated scaling exponent function is used for index stochastic process simulation in accordance with Multifractal Model of Asset Returns.
[16] http://en.wikipedia.org. Polynomial [http://en.wikipedia.org/wiki/Polynomial]. (Accessed 1. July 2012)