Эфект 'Северо-Восточного ветра волатильности' в разрезе бегущих волн. Спиральная структура коэффициентов Фурье волн волатильности
Пучков Андрей Александрович,
магистр экономики, докторант Рижского технического университета.
Andrejs Puchkovs,
Economist, Mg. oec., PhD student of Riga Technical University.
| Working capital ratio The working capital ratio is Working Capital Ratio = Current Assets / Current Liabilities. www.bookstime.com |
This article describes new properties of North-East Volatility Wind Effect. In current article North-East Volatility Wind Effect is analyzed from traveling wave perspective.
After
Volatility evolution matrix ![]() is obtained, by averaging
volatility evolution matrix in a complex plain. Volatility evolution matrix at
is obtained, by averaging
volatility evolution matrix in a complex plain. Volatility evolution matrix at![]() fixed time
fixed time ![]() is considered as a function of
interlayer volatility radius
is considered as a function of
interlayer volatility radius![]() . Additional transformation is
done by using (1) equation.
. Additional transformation is
done by using (1) equation.
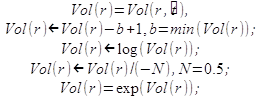 (1)
(1)
Transformation results are illustrated for Dow Jones Industrial Index next:
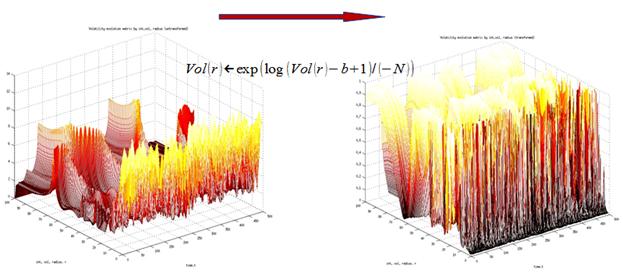
Fig. 1. Visualization of Transformation.
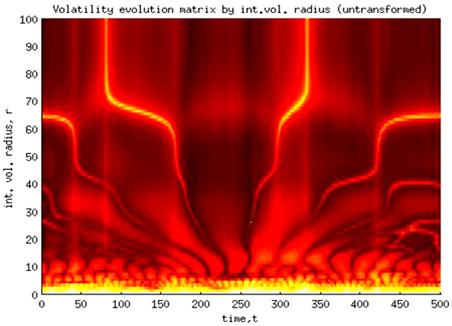
Fig. 2. Untransformed volatility evolution matrix.
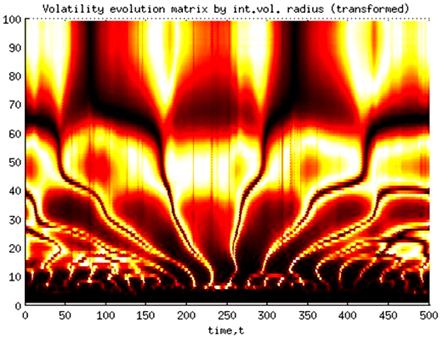
Fig. 3. Transformed volatility evolution matrix.
Implemented
transformation brings out North-East Volatility Wind Effect understanding from
traveling waves perspective. Volatility evolution function at ![]() fixed time
fixed time![]() to be considered as analyzed
signal. Let's call function as
to be considered as analyzed
signal. Let's call function as ![]() 'volatility pie' (at fixed time
'volatility pie' (at fixed time![]() -
-![]() ). This function is represented in frequency domain
by using Fast Fourier Transform.
). This function is represented in frequency domain
by using Fast Fourier Transform.
![]() (2)
(2)
Fourier coefficients are represented in 4 a). Fig (top left corner).
Consider
function ![]() which also is represented in
frequency domain.
which also is represented in
frequency domain.
![]() (3)
(3)
Fourier coefficients are represented in 4 b). Fig (top right corner).
Function
![]() (at fixed time -
(at fixed time -![]() )
)![]() is shown in 4 c). Fig (bottom left corner).
is shown in 4 c). Fig (bottom left corner).
Overall
volatility function ![]() is shown in 4 c). Fig (bottom
right corner). Suppose time is fixed at time
is shown in 4 c). Fig (bottom
right corner). Suppose time is fixed at time ![]() .
.
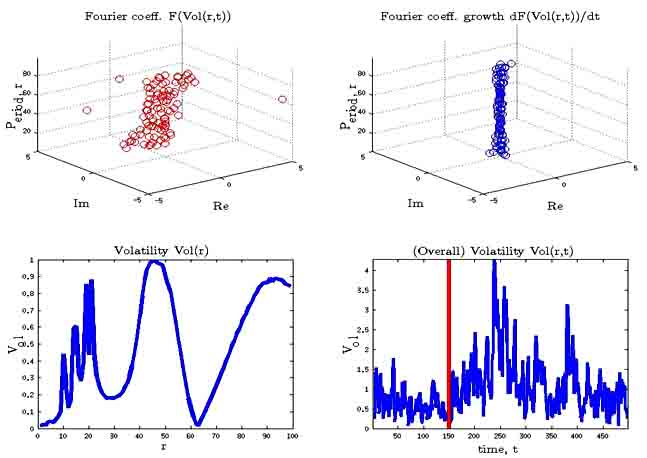
Fig. 4. Volatility pie as traveling wave in time![]() .
.
a) Volatility pie in frequency domain(t![]() op left corner);
b) Function(t
op left corner);
b) Function(t![]() op right corner); c) Volatility
pie
op right corner); c) Volatility
pie ![]() (bottom left
corner); d) Overall volatility function
(bottom left
corner); d) Overall volatility function ![]() (bottom right
corner)
(bottom right
corner)
The
same picture is obtained in fixed time ![]() , Results are represented in next figure.
, Results are represented in next figure.
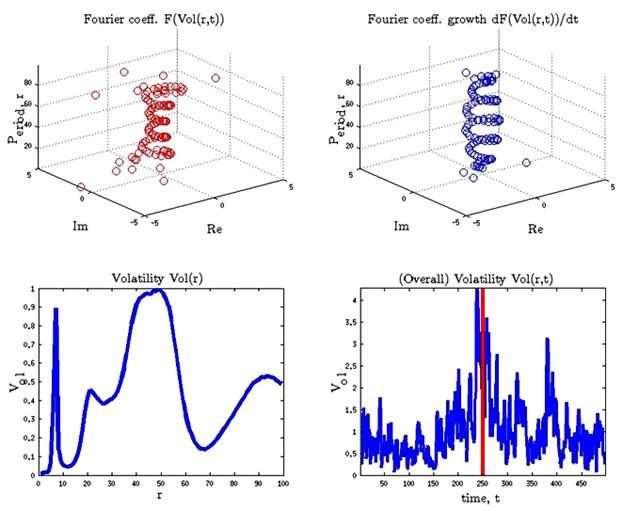
5. Fig. Volatility pie as traveling wave in ti![]() me
me
a) Volatility pie in frequency domain(t![]() op left corner);
b) Function(t
op left corner);
b) Function(t![]() op right corner); c) Volatility
pie
op right corner); c) Volatility
pie ![]() (bottom left
corner); d) Overall volatility function
(bottom left
corner); d) Overall volatility function![]() (bottom
right corner).
(bottom
right corner).
4.
Fig. Is illustrating The Dow Jones Industrial Average index volatility pie at
time ![]() which is correspondent to 2006
year. (before financial crisis 2007). According results Volatility pie in
frequency domain and
which is correspondent to 2006
year. (before financial crisis 2007). According results Volatility pie in
frequency domain and![]() did not have clear structure. The
same conclusions are done about function
did not have clear structure. The
same conclusions are done about function![]() .But in time
.But in time ![]() (during financial crisis 2007 peak) the picture has
been changing and functions a
(during financial crisis 2007 peak) the picture has
been changing and functions a![]() and
and![]() acquired clear helical (spiral) structure. This
effect is explored by less number of explicit harmonics (harmonics with higher
magnitude). After market crisis 2007, clear clear helical (spiral) structure
was lost.
acquired clear helical (spiral) structure. This
effect is explored by less number of explicit harmonics (harmonics with higher
magnitude). After market crisis 2007, clear clear helical (spiral) structure
was lost.
This
effect can be used for stock market stability research. As a measure of
structure could be used minimal total distance between all points i![]() n and/or
n and/or ![]() or similar metrics. That measure can be used as
measure of risk alternative to volatility measure.
or similar metrics. That measure can be used as
measure of risk alternative to volatility measure.
Bibliography
1. BASU, T. K. Lecture Series on Digital Signal Processing. IIT Kharagpur, 2013, 555 s.
2. BURNAEV Primenenije vejvlet preobrazovanija dla analiza signalov. MFTI, 2007, ISBN 5-93517-103-1, 138 s.
3. CAPINSKI, M., T., Z. Mathematics for Finance An Introduction to Financial Engineering.Springer, 2010, 309 s.
4. GADRE, V. M. Lecture series in Multirate Digital Signal Processing and Multiresolution analysis. IIT Bombay, 2013, 555 s.
5. JAKOVLEV, A. N. Vvedenije v vejvlet preobrazovanija. NGTU, 2003, ISBN 5-7782-0405-1,576 s.
6. PUČKOVS, A. Equity Indexes Analysis and Synthesis by Using Wavelet Transform. In: 7th International Conference on Computational and Financial Econometrics (CFE 2013): Programme and Abstracts, United Kingdom, London, 13-16 December, 2013. Birkbeck: University of London, 2013, pp.98-98.
7. PUČKOVS, A. Stock Indexes Volatility Evolution Research in Volatility Layers. Журнал научных публикаций аспирантов и докторантов, 2014, Nr5(95) Mai2014, pp.32-37. ISSN 1991-3087.
8. PUČKOVS, A. Computational Aspects of 'North-East Volatility Wind Effect'. Журнал научных публикаций аспирантов и докторантов, 2014, Nr5(95) Mai2014, pp.261-274. ISSN 1991-3087.
9. PUČKOVS, A. Stochastic Process, Based on North-East Volatility Wind Effect. Журнал научных публикаций аспирантов и докторантов, 2014, Nr5(95) Mai2014, pp.220-226. ISSN 1991-3087.
10. PUČKOVS, A., MATVEJEVS, A. ’North-East Volatility Wind’ Effect. In: 13th Conference on Applied Mathematics (APLIMAT 2014): Book of Abstracts: 13th Conference on Applied Mathematics (APLIMAT 2014), Slovakia, Bratislava, 4-6 February, 2014. Bratislava: 2014, pp.67-67. ISBN 9788022741392.
11. PUČKOVS, A., MATVEJEVS, A. ’Northeast Volatility Wind’ Effect. Aplimat Journal, 2014, Vol.6, pp.324-328. ISSN 1337-6365.
12. SMOLENCEV Osnovi Teoriii Vejvletov v MATLAB. DMK Press, 2005, ISBN 5-94074-122-3,304 s.
13. Fourier series. Introduction. liraeletronica.weebly.com [http://liraeletronica.weebly.com/uploads/4/9/3/5/4935509/introduction_fourier_series.pdf] (Accesed 01. July 2014)
14. Fourier_series. Wikipedia.org. [http://en.wikipedia.org/wiki/Fourier_series], [http://en.wikipedia.org/wiki/Fourier_series#mediaviewer/File:Fourier_series_square_wave_circles_animation.gif] (Accesed 01. July 2014).
Поступила в редакцию 11.07.2014 г.