Формирование портфеля проектов с использованием метода стандартной динамики
Forming а portfolio of projects using the method of standard dynamics
Алимжанова Лаура Муратовна,
кандидат технических наук, ассоциированный профессор,
Хаджиев Амир Асматбекович,
магистрант.
Международный университет информационных технологий, Казахстан.
| Bookkeeping Quick Facts: bookkeeping, Accounting, and Auditing Clerks. www.bookstime.com |
In modern conditions, which are characterized by high turbulence of all processes in the environment of activities in management it is practically impossible to use traditional criteria and approaches to the formation of portfolios of projects aimed at achieving organizations strategic goals. This is especially crucial for non-productive enterprise sphere, who are forced to survive to pass on the methodology of project-based management. These are mainly small and medium-sized businesses. Today, these companies developed their own approaches, one of which, for example, based on the strategic concept of unity. This concept involves the formation of a portfolio of projects carried out taking into account long-term, short-term goals. As criteria for selecting the values of indicators that need to be achieved to a certain period of activity of the enterprise. But to predict such values is almost impossible today. This may result chaos and problems of behavioral consequences of the use incorrect criteria and their values.
After the global
crisis of 2008, the criteria methods have been used, which are based on
monitoring the rates of change indicators, instead on maximizing or minimizing their
values. At the design stage of criteria set is not absolute values of the
indicators, as an ordered sequence of the rate of change. This method is often
called standard dynamics index. Criteria which was constructed using this
method, determine the order of rates of change indicators, which ensures
compliance with the company's development in this direction. The simplest
example of such criterion can be the golden rule, which uses the indicators
rate of sales growth![]() and profits
and profits![]() :
:
![]()
Today, as part of this approach are already solved the problem accounting the distance indicator in the actual order of change indicators on the place in the standard order for a standard four-element series, developed the method of accounting for this factor, with unlimited number of items.
This paper proposes a mechanism for the selection of projects for the implementation of the strategic development objectives, primarily to non-productive sphere enterprises, which use criteria of standard dynamics indexes as a basic tool to assess the effectiveness of its activities. Construction of mechanism is necessary to develop a formation procedure for temporal order matrix, the project submission procedure for possibility of its inclusion in the list of candidate projects, method of accounting for the integral coefficient deviation of temporal order actual structure of standard in formation the portfolio and project selection rules.
Let’s have criterion of standard dynamics indexes given as inequality:
![]()
where T - rates of change indicators; n - number of indicators.
Subscript defines the place of a particular index in a standard dynamics of its reference rating i.e. it can be stated that compliance with the requirements forms certain strategic line of action of the enterprise in conditions of high turbulence of all processes in environment of its activities. When changing one of indicators in course of activity, others also can or should be changed, but in a way to not violated criterion of standard dynamics indexes to actually achieved values:
![]()
where t - index that shows, for what period calculated actual values of temporal parameters.
Values of T are calculated based on values of the indicators, which are fixed to certain points activity of the enterprise (Table 1):
![]()
Table 1.
Initial data for calculating actual indicators (T).
|
Index |
Control point number |
|||||
|
№ |
Name |
… |
t-1 |
t |
t+1 |
… |
|
1 |
a |
… |
|
|
|
… |
|
… |
… |
… |
… |
… |
… |
… |
|
n |
y |
… |
|
|
|
… |
The sequence of parameters in column corresponds to the established order in the criteria for indexes standard dynamics.
For clarity, limited, for example, 4 indicators and 6 control points. Under these conditions we have 5 periods for calculating actual indicators (T) (Table 2).
Table 2.
Indicator values (T) for various periods.
|
Index |
Number of period between control point |
|||||
|
№ |
Name |
1 |
2 |
3 |
4 |
5 |
|
1 |
Growth rate a |
|
|
|
|
|
|
2 |
Growth rate b |
|
|
|
|
|
|
3 |
Growth rate y |
|
|
|
|
|
|
4 |
Growth rate x |
|
|
|
|
|
Consider how to calculate the integral coefficient, which takes into account deviation of the actual structure temporal order from the standard. This requires creating a symmetric matrix for a certain period and size should equal to the number of indicators. For our example, it will be 4x4 matrix (Table. 3). In the matrix indicators are arranged in the manner prescribed in the criteria for standard dynamics indexes. To fill it, you must first create the actual temporal order for period t. For example, is as follows:
![]()
Transform it into a series of rating, which indicates the actual ratings location of standard dynamics indexes: 3>1>4>2
This rating row is transferred to the top row and leftmost column of Table 3.
Table 3.
Matrix for the period t.
|
|
t |
q |
||||
|
3 |
1 |
4 |
2 |
|||
|
|
|
|
|
|||
|
i |
3 |
|
|
1 |
0 |
1 |
|
1 |
|
1 |
|
0 |
0 |
|
|
4 |
|
0 |
0 |
|
1 |
|
|
2 |
|
1 |
0 |
1 |
|
|
Cells of the matrix that are diagonal to the right, horizontally filled using the following rules: if the rating, which is located in the first column of the table is less than the rating index, which is located in the top row, then the digit 1, otherwise 0. The highest rating is considered to 1. The lower half of the matrix is filled according to the symmetry rule. Based on the data of the matrix is calculated integral coefficient of variation of actual structure of the temporal order from the standard formula:
![]()
where i, q –
indexes of rows and columns the temporal order matrix; ![]() – value in the cell ij temporal
order matrix;
– value in the cell ij temporal
order matrix; ![]() – coefficient, which takes into account
distance of the actual location of temporal indicator from its original
location in standard dynamics indexes.
– coefficient, which takes into account
distance of the actual location of temporal indicator from its original
location in standard dynamics indexes.
Described theoretical positions are enough to answer the question of how to apply deviation integral coefficient of the actual structure of temporal order from the standard in forming the strategic development portfolio. Let us describe a method that allows to get an answer to this question.
Exploitation of the product of any project that claims to get into the portfolio must make changes in values of indicators of the enterprise, which are fixed at certain control points. Therefore necessary all the projects-applicants, _ represent in the form of a table similar to Table 1. In zero control point indexes of the project are equal to zero. And from the first control point, they should reflect the planned contributions that the company will receive from use the product of the project. A specific project, of course, cannot affect all parameters. Therefore are put in the table, only those for which it will affect (Table 4).
Table 4.
Example of representation the initial information on the project m.
|
Index |
Number of control point |
||||||
|
№ |
Name |
0 |
1 |
2 |
3 |
4 |
5 |
|
1 |
a |
0 |
0 |
|
|
|
|
|
2 |
b |
0 |
0 |
0 |
0 |
|
|
|
… |
… |
0 |
… |
… |
… |
… |
… |
|
n |
x |
0 |
0 |
0 |
0 |
0 |
0 |
This table can be called table-passport project-applicant. As can be seen from the table, m project will contribute in index of b only after the second control point, and it does not affect the index n. In real practice very rarely there are two project-applicant, whose contribution to the structure of the activity of the enterprise from the operation of their products will be the same. Therefore, each of m projects-applicants will have a unique passport. And it will depend on the uniqueness of the innovation, which is expected to be realized in the project. Before evaluation of importance of projects-applicants, need to create another table. This is a table of expected values of the indicators activity of the enterprise from the moment of selection in the portfolio. It has a form similar to Table. 4, and is called the base target table. Rules of filling:
1) in column with zero control point number are entered the actual values of indicators that achieved at the time of selection
2) then are filled with all the cells of the table the values of the indicators are expected to be achieved without the implementation of new projects.
Predicting indicators is also a separate problem that is not considered in this research. In addition, it should be known to the integral coefficients of the actual structure temporal order of deviation from the standard of the previous ones, at least three periods. Those known as K0, K-1, K-2.
The next step is the creating contribution table for each m project-applicant. It has the same form as Table 4, and the value in each cell is equal to the sum of the base target value table and table-passport of project m. If the limitations serve the maximum amount of funds that can be allocated to several projects, for each period, is created several matrices of temporal order. Their quantity is determined by the number of possible combinations of all projects-applicants. The number of possible combinations initially checked for fulfillment of the condition:
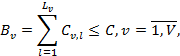
where B – the
maximum amount of possible funding of projects to be included in the portfolio;
![]() – the costs of implementing the l-th
project in v-th combination of projects;
– the costs of implementing the l-th
project in v-th combination of projects; ![]() – costs of implementing v-th
combination of projects; V – maximum possible number of combinations of the
projects;
– costs of implementing v-th
combination of projects; V – maximum possible number of combinations of the
projects; ![]() – maximum number of projects in v-th
combination.
– maximum number of projects in v-th
combination.
For the
portfolio are selected only those variants that have a positive trend change
coefficient ![]() .
More profitable is the option with more positive trend. The advantage is a
variant with lower values of the coefficient differences between the periods.
.
More profitable is the option with more positive trend. The advantage is a
variant with lower values of the coefficient differences between the periods.
Today, in the conditions of fast changes exist the acute problem of formation of a portfolio of projects for innovation, which are an integral component of the survival of any enterprise. Logically justifiable the move from assignment development strategies in the form of a set of indicators the values and time periods in which they are to be achieved, the presentation of strategic objectives in the form of indexes standard dynamics. Developed mechanism for selecting projects in the portfolio based on criteria of standard dynamics indexes allows to take such management decisions, which, thanks to a combination of projects that allow the implementation of selected strategic course behavior of the enterprise.
References
1. V. V. Kovalev, O.N. Volkova. Analysis of economic activity of the enterprise.
2. A. M. Beketova, article: Evaluation of target investment attractiveness of the enterprise by using the method of dynamic standard.
3. A. S. Tonkih, article: Identification and elimination weaknesses in financial activities.
4. L. L. Zayonchik, article: Comprehensive integrated portfolio evaluation of innovation projects.
5. A. S. Tonkih, article: Resource Management Features in corporate systems.
6. N. V. Tereshchenko, N. S. Yashin, article: Asesment of performance shall be effectiveness.
7. L. A. Gendler, article: On the integrated assessment of economic dynamics of business on the basis of financial statements.
8. E. V. Shestakov, article: Methodical bases of estimation stage development companies as a self-organizing system.
Поступила в редакцию 05.05.2016 г.